Digital Solutions
MonitorIQ® Next
Best-in-class geotechnical analysis platform for GroundProbe systems.
A dedicated geotechnical analysis platform.
A dedicated geotechnical analysis platform.
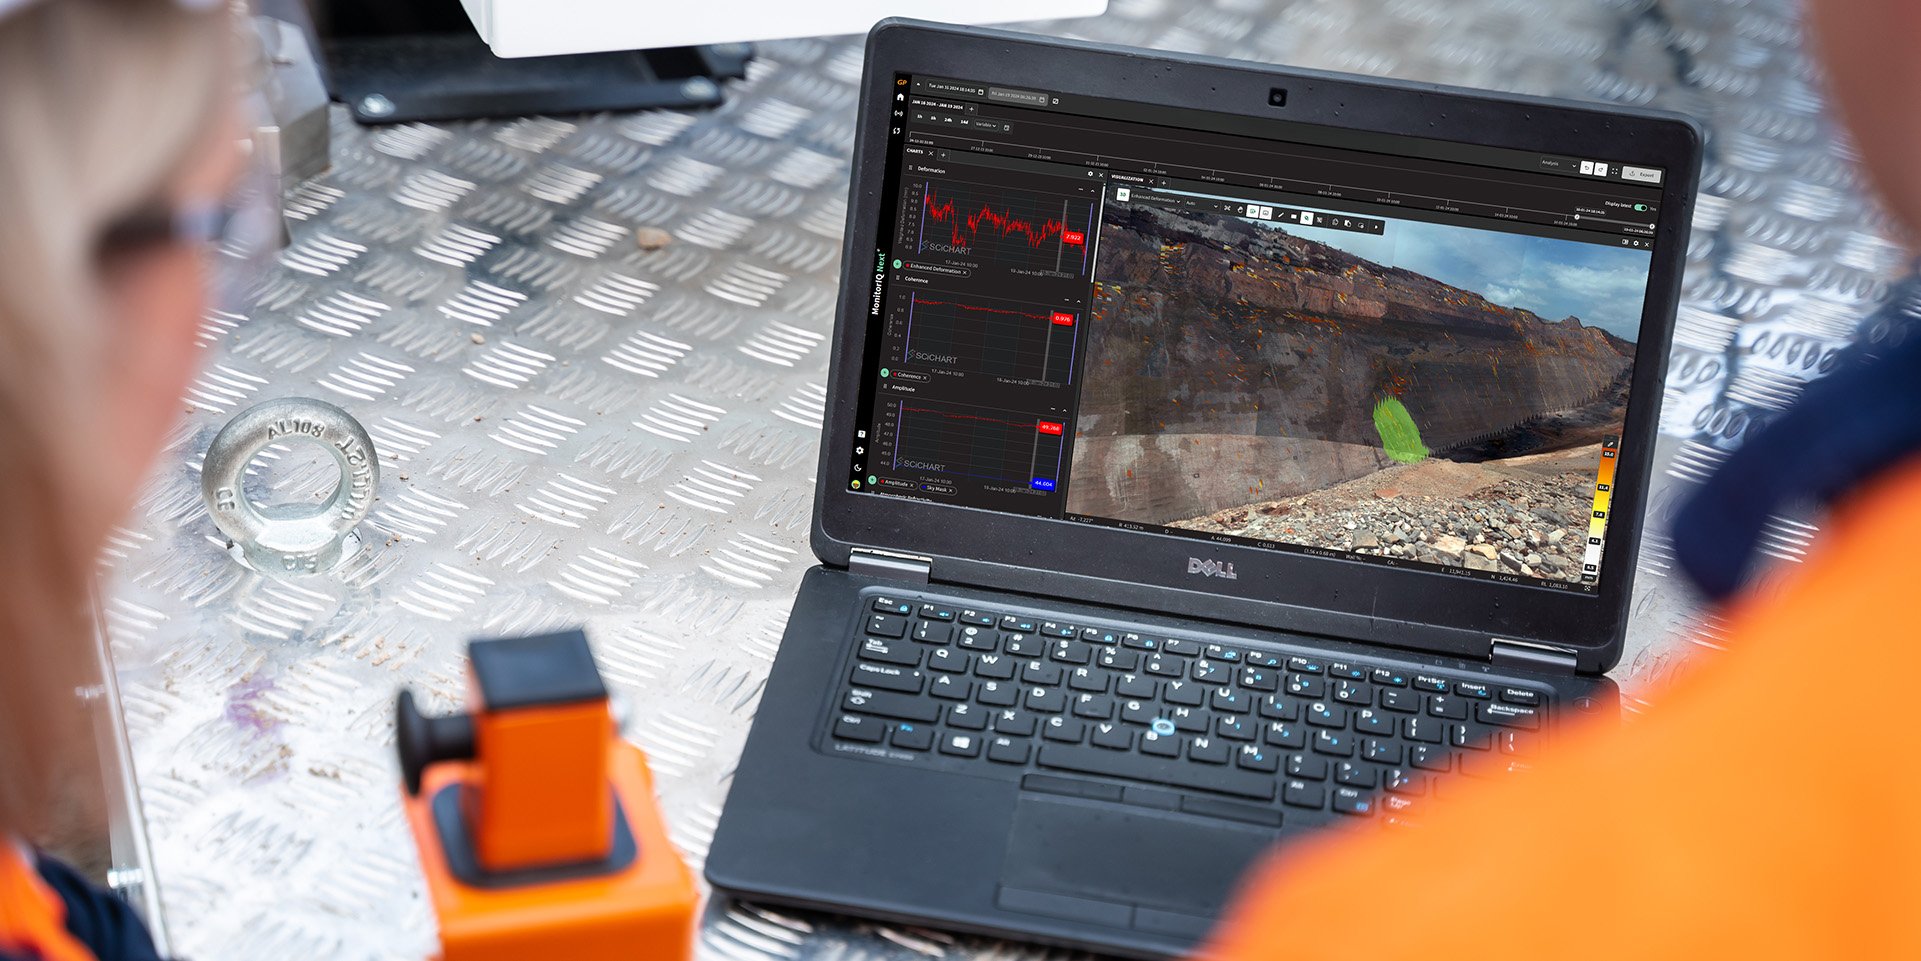
Introducing MonitorIQ® Next, our next-generation software platform, offering a brand-new look, customisable UI, streamlined workflows, web access and a range of superior new features.
MonitorIQ® Next is our dedicated geotechnical analysis platform and the standard platform across all our GroundProbe systems and sensors.
Our MonitorIQ® Next software provides rapid and precise data analysis to detect trends and send alerts for immediate action.
Benefits
Benefits
Our products and services are designed to help you achieve safer, more efficient and more sustainable outcomes, wherever you operate.
Improve safety
Data insights
Social license to operate
Total cost of ownership
Features and benefits
Features and benefits
Historical MonitorIQ® Features Included
All your favourite MonitorIQ® Desktop features are included in our next-generation MonitorIQ® Next platform, which is now enhanced with a flexible, customizable interface that lets you decide how your data is displayed.
Precision Atmospherics® enabled
GroundProbe’s Precision Atmospherics® is a revolutionary atmospheric correction algorithm that distinguishes and significantly reduces the noise in Slope Stability Radar (SSR) data, inherently caused by changing atmospheric conditions. It is currently available on our 2D-Real Aperture Radars: SSR-FX and SSR-Omni.
Collapse forecasting
Best-in-class charting tools
Web-Access Enabled
Customisable UI
Industries
Industries
Iron ore
Surface metal
Surface coal
Construction
Quarrying
Explore more
We are a global leader in geotechnical, geospatial and structural monitoring. We deliver a complete portfolio, from sensors to services, for mining and civil infrastructure customers. Our expertise is grounded in Orica's innovation and technical excellence that span more than 150 years.
Contact an expert
Contact an expert
Whether you need support or simply want to learn more, reach out to our Geosolutions team. We’re here to help.
GroundProbe
24/7 Support Desk
Phone: +61 7 3010 8900