
Case Study
Modal analysis at Syscom
08 Jan 2025
Sainte-Croix (VD), Switzerland
Summary details
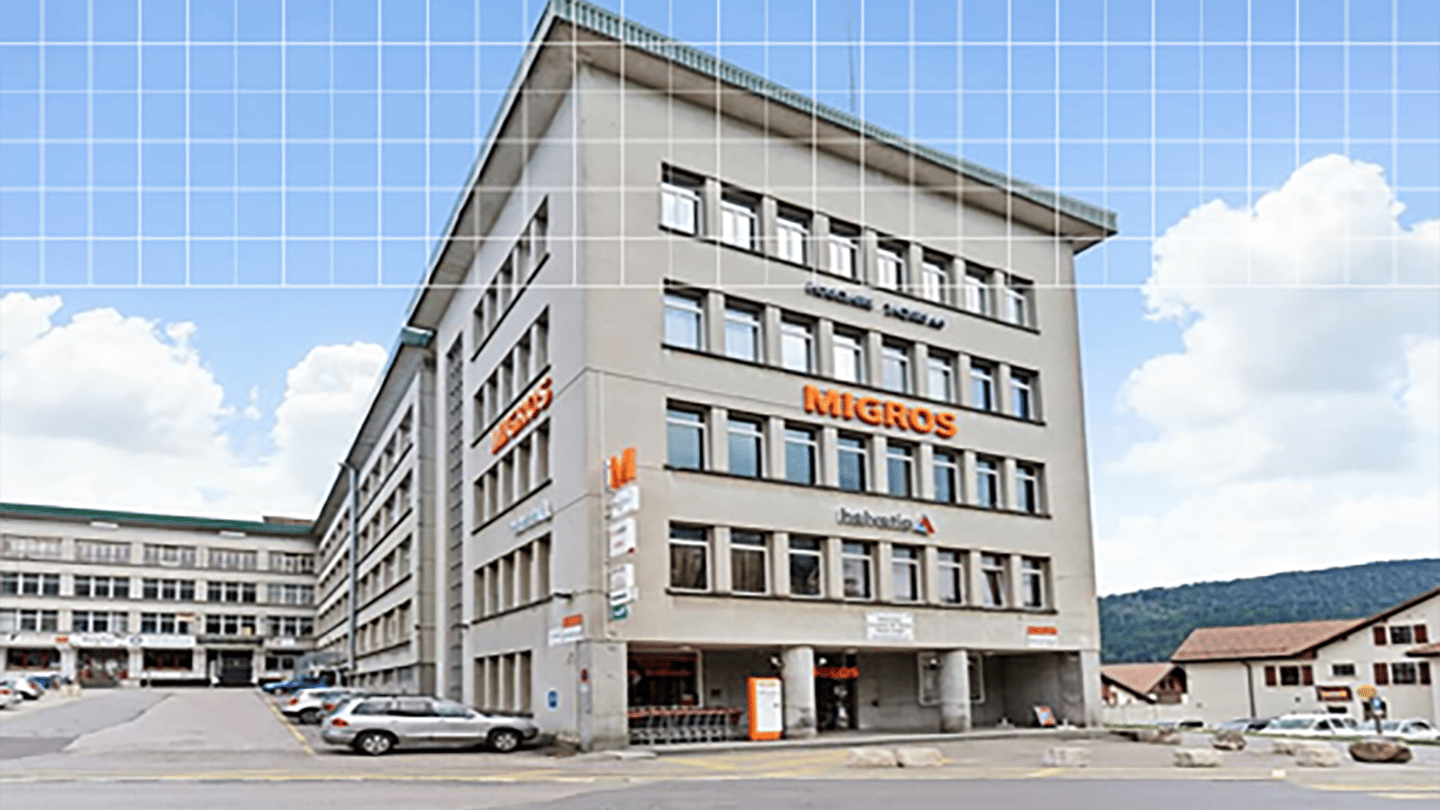
Structure monitored: Concrete building
Location: Sainte-Croix (VD), Switzerland
Technology: Syscom ROCK Acceleration
Measurement points: 7
Objective: Modal analysis of the floor where Syscom is based
Monitoring time:
Overview
Modal analysis is a technique used to estimate the vibrational behavior of a structure. The primary outcomes of this analysis are the modal parameters: natural frequencies, mode shapes, and damping factors. These parameters can be compared with those derived from a simulated model to update the model, facilitate the commissioning of a new structure, or monitor changes over time by comparing them with previous measurements from the same structure, enabling the detection of potential damage.
To achieve the high time synchronization accuracy required for modal measurements, ROCK Acceleration units, offering a precision of 10 μs in a fully wireless configuration, have been installed in the Syscom headquarters building in Switzerland. The estimation of modal parameters is conducted using Artemis software, developed by the Danish company Structural Vibration Solutions.
Configuration setup
Modal analysis is conducted using a total of four ROCK Acceleration units, comprising two units with MS2010+ sensors and two with MS2012+ sensors, across two different setups.
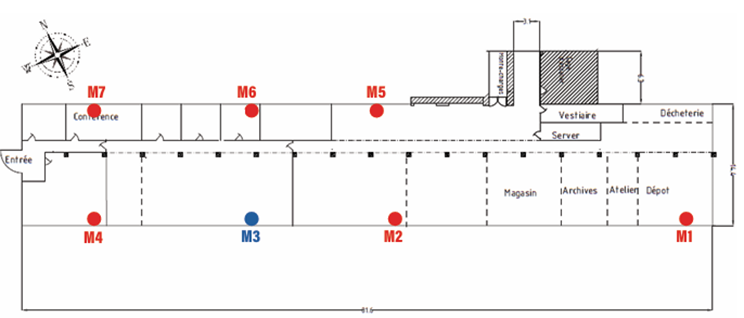
In the first setup, all units are installed in the southern part of the building, distributed across different locations. The measurement points are designated as M1 to M4.
In the second setup, the ROCK Acceleration unit at M3 (Figure 1) remains fixed and serves as a reference point. The other units are repositioned to the northern side of the building. The measurement points for this setup are M3, M5, M6, and M7.
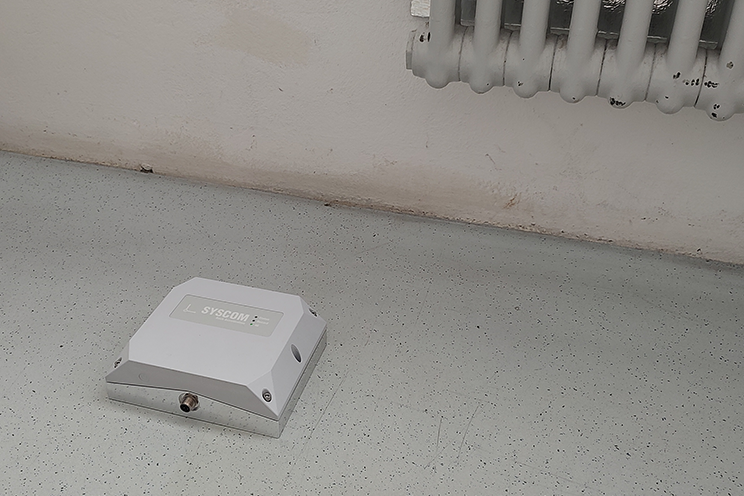
Figure 2 and Table 1 provide a comprehensive overview of the setups.

Installation process
The installation process was quick and straightforward. The units were activated effortlessly using the dedicated magnet and connected to the LTE network within seconds. Despite being located indoors (close to windows), they acquired the GNSS signal in approximately one minute.
Two types of tests were conducted across both setups to assess the structure’s response:
- Ambient Vibration Test: Performed without any external excitation of the structure.
- Impact Test: Conducted by repeatedly dropping a large bin onto the ground to generate vibrations.
These tests were executed using the Common Recording feature available on the SCS Cloud Software. Detailed information about this functionality can be found in the Syscom video library at: https://www.syscom.ch/videos.
Analysis and results
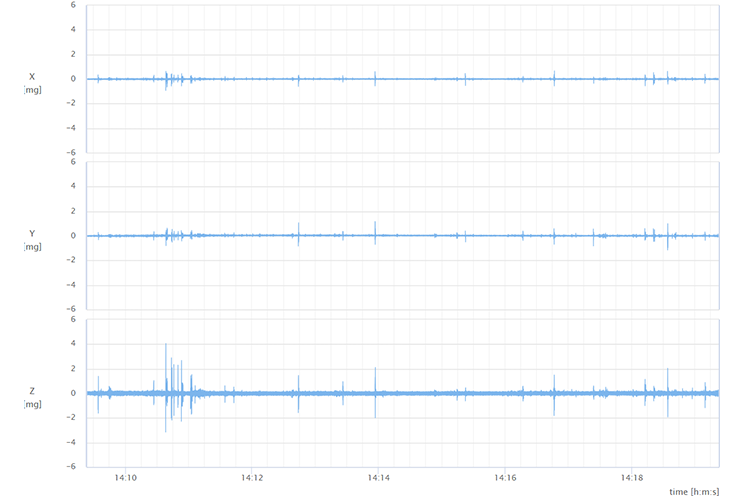
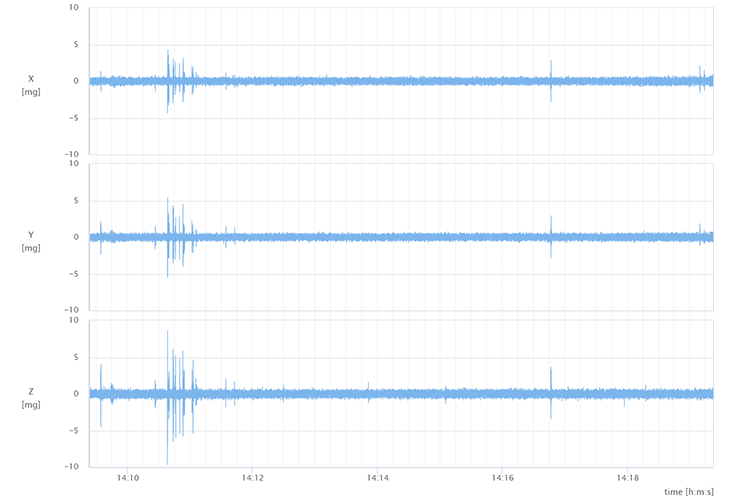
Data is automatically transmitted to the SCS cloud software, where it is exported in TXT format to be used inside Artemis software. Figure 3 shows the accelerations recorded by M1 and M2, during a test with multiple impacts on the floor, done few meters away from M3. The time histories highlights that:
- The acceleration peaks are higher in M2 than in M1, since M2 is closer to the impact location.
- The noise level is higher in M2 (around 0.5 mg) than in M1 (around 0.05-0.1 mg). This is explicable by the fact that in M2 there is a MS2012+ sensor, while in M1 there is the high-sensitive MS2010+ sensor.
 |  |
Inside the Artemis software the following steps have been followed:
- Creation of a geometry to represent the Syscom floor
- Assignment of the data recorded to the different physical points on the geometry
- Estimation of the modal parameters.
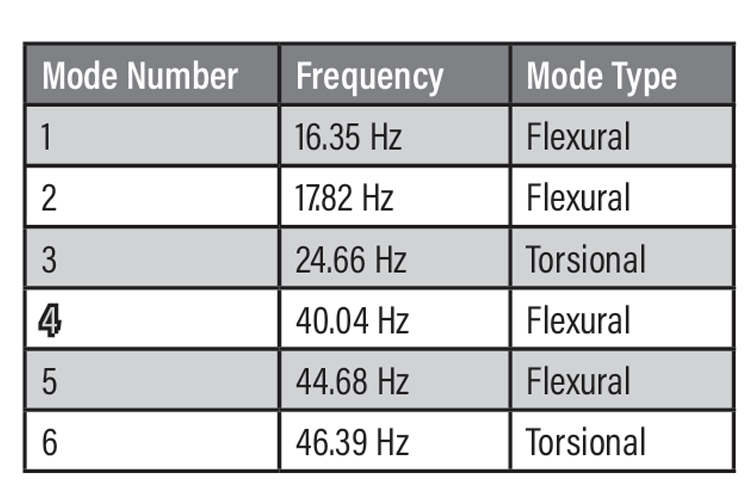
Table 2 presents the first six vibration modes, including their associated natural frequencies and an estimation of their mode types.
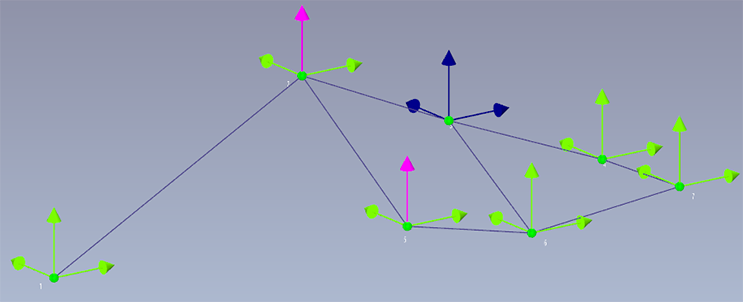
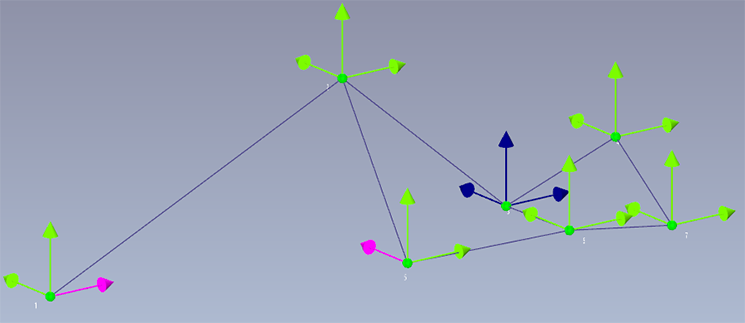
Figures 4 and 5 provide visual representations of the second and third modes, highlighting key structural behavior. The arrows in the figures indicate that each measurement point was equipped with a triaxial accelerometer. To emphasize consistency across setups, the axes at M3 are shown in blue, marking it as the common reference point between the two configurations.
This comprehensive setup ensures precise and reliable data collection, enabling in-depth structural analysis.
Conclusion
The installation of four ROCK acceleration units at the Syscom headquarters showcased the advanced capabilities of Syscom‘s solutions for structural monitoring and analysis. Operating in a fully wireless configuration, the units provided synchronized data with remarkable ease and precision.
The measurement process was straightforward, initiated directly from the SCS Cloud Software after the quick and simple device installation. The units swiftly established LTE and GNSS connections, ensuring reliable and efficient data acquisition, even within an indoor environment.
Post-processing with Artemis software enabled the identification of the structure’s first natural frequencies and vibration modes. The combination of Syscom‘s ROCK acceleration units and SCS Cloud Software delivered a seamless workflow, from effortless setup to detailed analysis, highlighting their suitability for both complex structural assessments and routine monitoring.
- END -