

Case Study
Laboratory evaluation using vibration criterion - VC curves
03 Feb 2020
Introduction
The purpose of this use case is to give general information about vibration evaluation inside laboratories in reference to commonly used VC curves. Best practices from existing literature with a suggested methodology using Syscom Instruments MR3000C devices are described in this use case. The current case is referring to a unique evaluation process that can be tailored to specific configurations and needs for best relevance.
 |
General vibration evaluation
Vibration monitoring is crucial when laboratories are dealing with micro- and nano-technologies to ensure the best manufacturing processes with the highest accuracy and reliability.
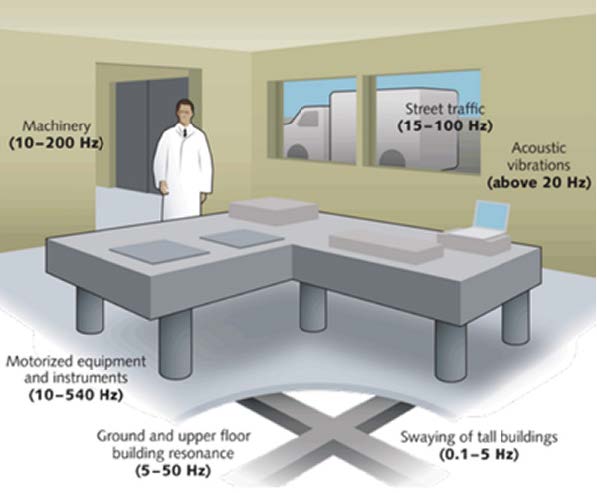
Vibrations are created by multiple sources, from weak seismic motions of the ground earth, from machinery, structures and other sources as well (Figure 1). During the design phase of the laboratory, specific modelization is usually performed to analyze and isolate it from external sources of vibration. A critical aspect is the amortization of the ground borne vibrations from the start, using specific materials and construction techniques, seldom put in place post-construction due to very high related costs. However, it is not the only vibration that needs to be addressed, as mentioned, also coming from internal sources.
In order to detect and mitigate all these vibrations, it is required to put a monitoring in place, analyze the full spectrum and isolate the relevant frequencies. Following the isolation phase, a further step is the laboratory evaluation related to VC curves, in order to comply with specific instrumentation requirements in terms of acceptable vibration noise floor.
ISO and VC curves evaluation
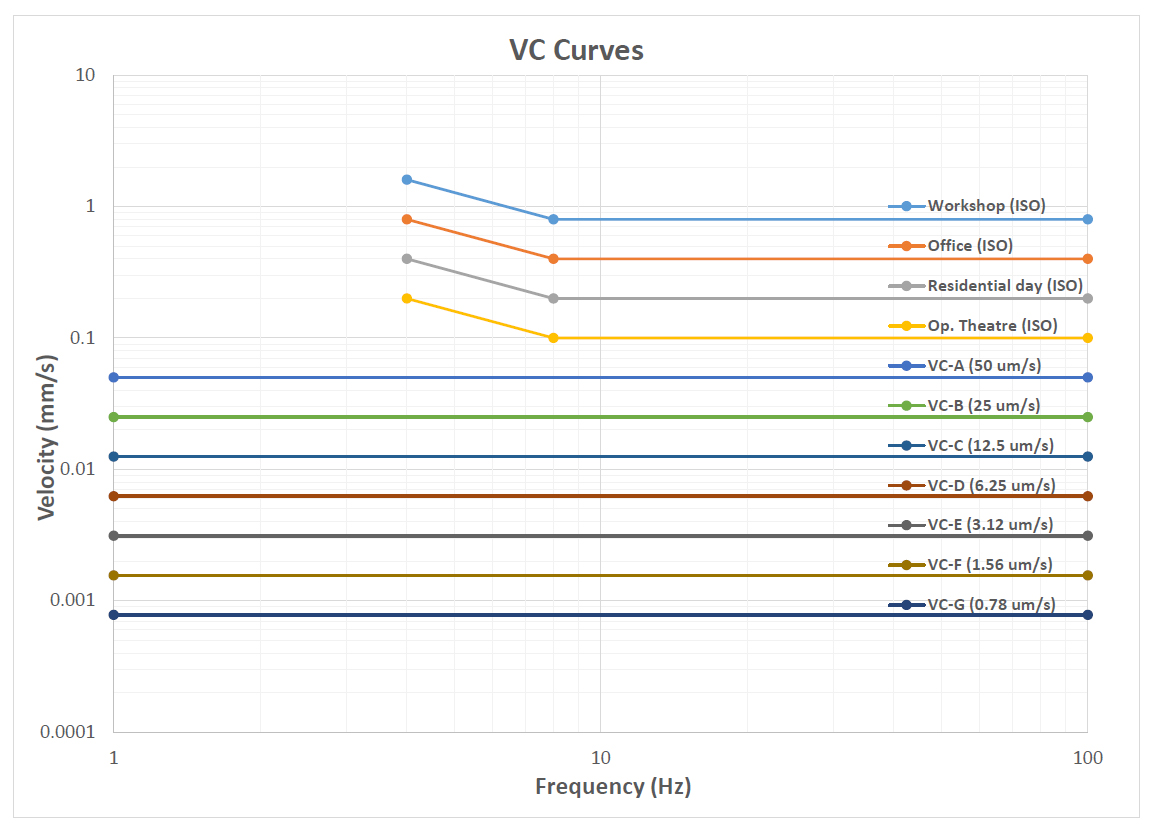
The criterion curves were developed to have design standards to accommodate a wide range of tools and instruments used by several industries. The VC curves (Figure 2.) are now widely accepted as a basis for designing and evaluating the performance of microelectronics fabrication facilities where vibration-free tool performance is essential.
VC curves methodology:
- Calculating the signal frequency bands using 1/3 octave spectrum. Usually the vibration is dominated by random broadband energy spectrum and not periodic. 1/3 octave band spectrum is easier to interpret, while narrow band spectrums are more suitable for vibration source detection.
- Evaluating RMS velocity signals, using 1 s slow time constant (0.125 s fast time constant and slower also possible), taking into account horizontal and vertical planes.
- Consider frequencies from 4 Hz to 100 Hz, sometimes lowered to 1 Hz when pneumatic isolation is involved (expected resonant frequency range around 1 Hz to 3 Hz)
A monitoring should be performed during a certain duration (1 day, 1 week), in order to detect constant and transitory vibrations over an extended period of time. This is relevant for laboratory evaluation in operating conditions and addressing vibration criterion with a more statistical oriented approach.
 |
Applications
- Facility & laboratory design
- Microelectronics fabrication, semi-conductor industries
- Medical & pharmaceutical research
- Vibration-sensitive equipment
- Microscopy, lasers, optical systems
- Micro, nano-technologies
Use case
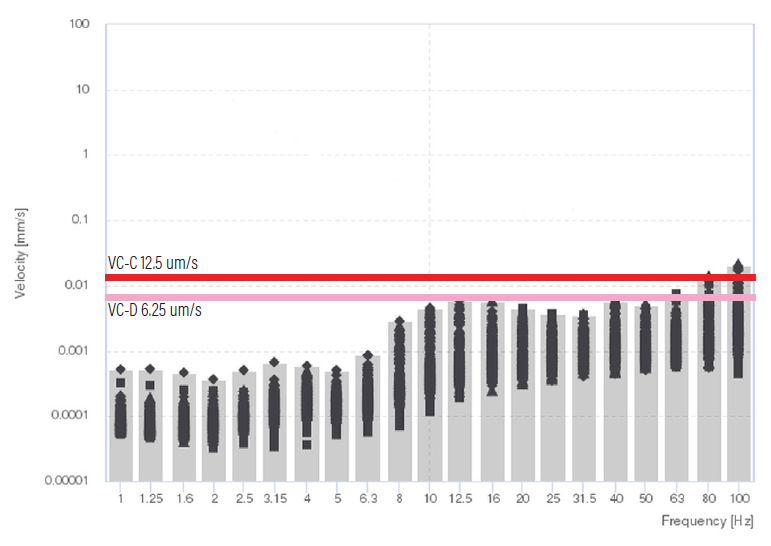
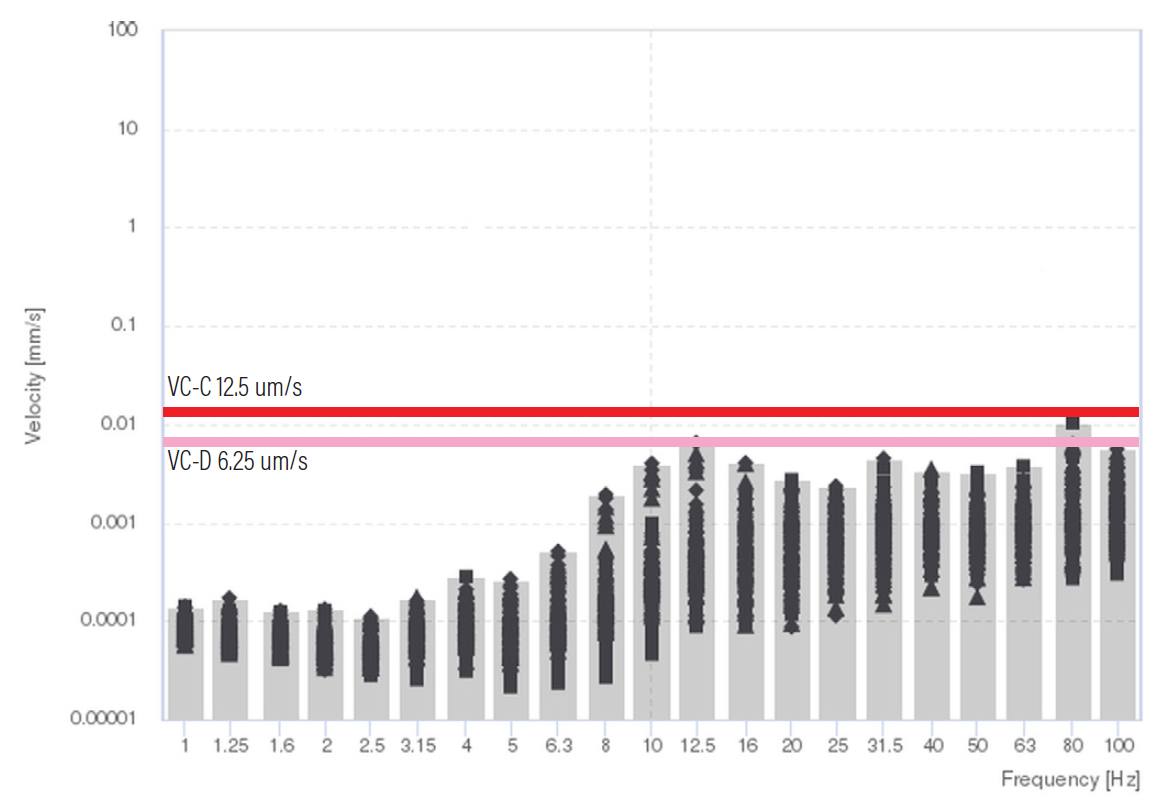
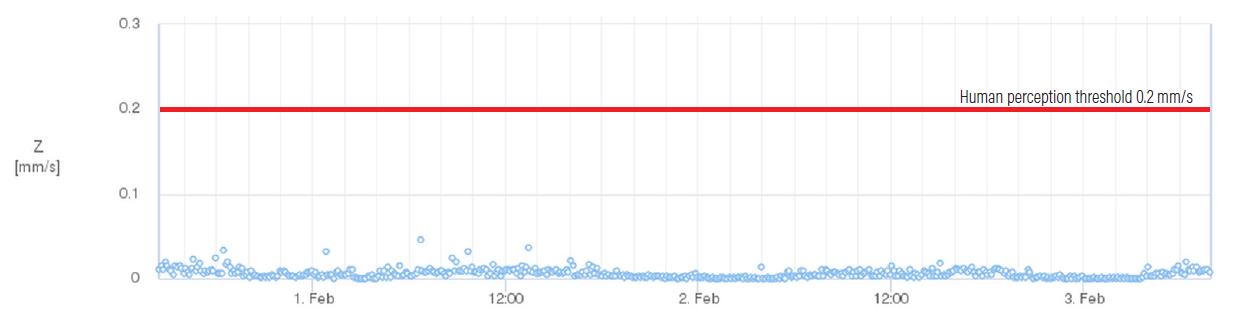
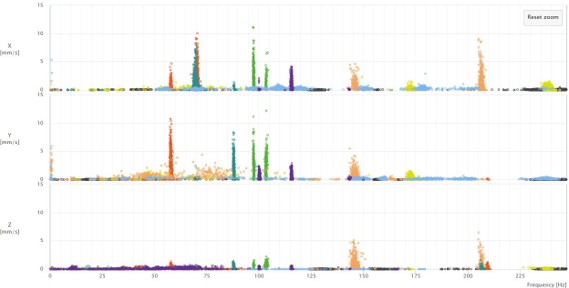
The following measures were taken in a laboratory in Singapore for evaluation purposes. The objective was the assessment of the laboratory versus VC curves during operations, with day and night triggered events and continuous background files for general overview. Refer to Figures 3 to 5 for results.
 |  |
 |
Laboratory evaluation methodology
The following methodology can be used for vibration evaluation in laboratories.
- Set up the monitoring system in every sensitive location inside the laboratory. Several measuring points can be taken at the same time or the device can be moved around in order to cover multiple areas of the laboratory. It may be interesting to measure floor and isolated table response vibrations at the same time when relevant.
- Continuously record a 1-minute file for 24 hours. This will generate 1440 vibration samples for processing. The duration of the monitoring may be done during one week for more thorough evaluation.
- Classify these files into operating conditions during day hours and pseudo base conditions during night hours. This is obviously a practical shortcut and the true base conditions should be evaluated prior to the installation of any type of machinery in the laboratory whenever possible, during the whole day/week.
- Process the data into 1/3 octave RMS signals and display every 1-minute file into one graph with VC curves plotted. Prior to this evaluation, an analysis of all the individual samples may be done to sort out the non-relevant vibrations, typically shocks on the device itself. A statistical classification of the samples versus relevant VC curves may be done as well.
- Check the lower VC curve that complies with all these events. This will give the laboratory qualification level according to the vibration criterion at a punctual period of time. Qualification level may vary depending of the laboratory surroundings, ongoing isolation improvements and machinery aging.
- Further analysis can be done to assert the VC criterion versus the acceptable limit of the instrumentation used in the laboratory and take actions when required.
Evaluation results
Process the recorded 1-minute signals into 1/3 octave RMS bands. A continuous background recording (Figure 5.) can give the laboratory vibration trend and a quick overview over a long period of time, however fine analysis should be performed using dynamic signals only. An interesting feature enabled with Syscom MR3000C devices is the timed recording function. It will record a vibration sample periodically, typically during one minute. Linked to the Syscom Cloud Software, an automated report using 1/3 octave RMS band can be generated for continuous criterion evaluation. This automated solution is also trigger based, able to generate notifications to relevant stakeholders in case of unexpected high vibrations happening.
 |
Suitable product lines
Laboratory evaluation using VC curves is not trivial. In order to proceed with relevant evaluation, suitable instrumentation must be used.
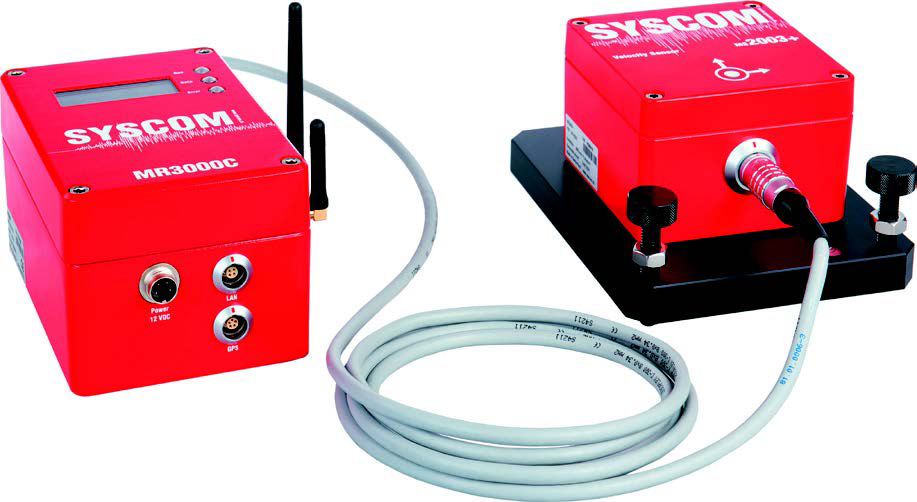
The MR3000C from Syscom is adapted for these types of measurements based on the following specifications:
- Measurement with a triaxial velocity sensor, using geophones
- Ultra-sensitive sensor with self-noise suitable up to criterion curve VC-F (VC-G with DRO option, refer to below table)
- Acquisition motion recorder unit with timed recording features, enabling continuous monitoring during several hours, automatically splitting the files into 1-minute samples for easier post-processing and analysis
- Post-processing software Syscom Cloud Software for multiple 1/3 octave RMS evaluation files and permanent background monitoring. Other software suitable for this kind of analysis as well.
- Calibrated accurate instruments with 1 Hz to 100 Hz raw signal filtering.
 References | 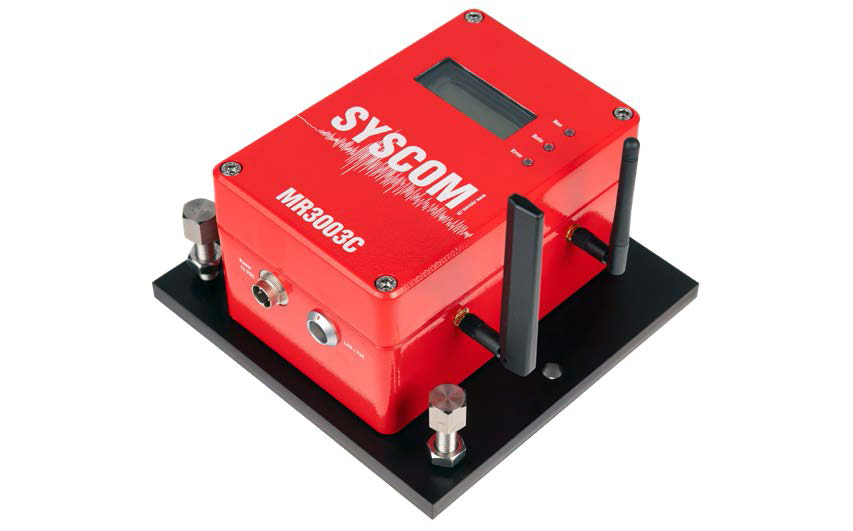 |
The Syscom MR3000C noise levels are highlighted in the following table, for a 100 Hz bandwidth:
| Instrument | Instrument self noise | VC curve suitability |
| MR3000C with internal MS2003+ sensor | typically 0.1 um/s | Up to VC-F 1.56 um/s |
| MR3000C with external MS2003+ sensor, DRO option | typically 0.05 um/s | typically 0.05 um/s |
References
- Generic Criteria for Vibration-Sensitive Equipment, Colin G. Gordon, SPIE Proceedings Volume 1619, 1991.
- www.minusk.com Vibration isolation platforms technologies.
- www.tbtappauf.at Practical VC curve methodology insights.
Conclusion
Laboratory evaluation in terms of vibrations is becoming more and more important for micro and nano industries, especially in the semi-conductors segments. Vibration criterion curves give a practical and standardized approach for laboratory evaluation and classification that is widely accepted. Periodic laboratory evaluation is required to ensure stable performance over time, even with aging machineries.
Syscom Instruments MR3000C devices are suitable for this type of evaluation and ensure straightforward data acquisition for reliable, comprehensive VC curve evaluation.
- END -