Case Study
Motionary’s Cumulative Heatmap Update: In-focus
05 Aug 2025
3vG is pleased to announce a new heatmap type within Motionary: cumulative displacement. Complementing our existing displacement rate heatmaps, this highly anticipated feature provides an intuitive overview of how much a specific area has moved since the start of your selected period.
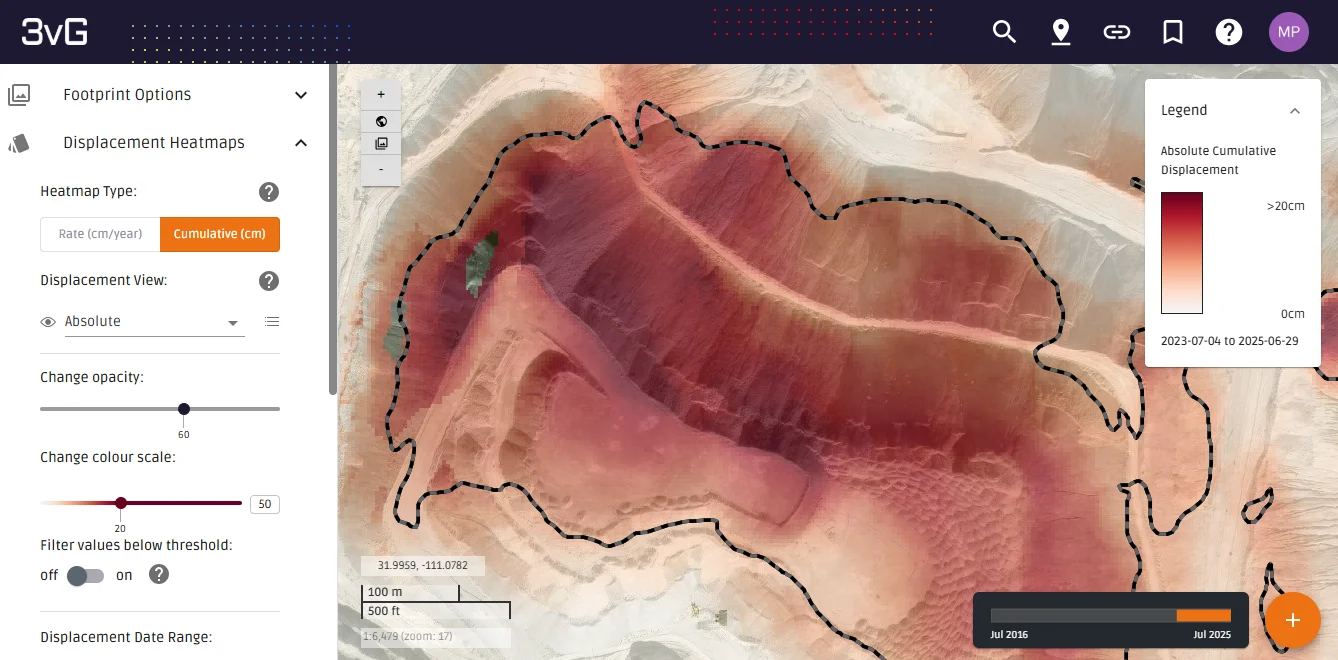
Motionary users can toggle between heatmap types and select displacement view.
Previously, Motionary's heatmaps displayed the rate of displacement (e.g., cm/year). While invaluable for identifying active movement, users often expressed a need to visualize the total accumulated displacement over a given period. The new cumulative displacement heatmap addresses this directly, displaying the total ground movement (in cm, mm, or inches) over your selected date range.
What are displacement heatmaps?
Motionary visualizes InSAR data using heatmaps, where the magnitude of the measured displacement is represented by color. The heatmaps provide an intuitive overview of detected ground movement across a site, clearly distinguishing areas of displacement from stable regions. The heatmap visualization parameters that can be configured in the Displacement Heatmaps section in the left panel include:
- Heatmap type (rate or cumulative)
- Displacement view (vertical, horizontal, absolute, line-of-sight)
- Opacity
- Colour scale maximum (value at which the heatmap color reaches full saturation)
- Displacement threshold (to filter out stable or slow moving areas)
- Displacement date range
The overall heatmap colour theme is adjustable in the Preferences section, also found in the left panel.
What are the different heatmap types?
Motionary supports two types of displacement heatmaps:
- Displacement rate Displays the average rate of displacement over a selected date range in units per year (cm/year, mm/year, or in/year).
- NEW! Cumulative displacement Displays the accumulated displacement (in cm, mm, or inches) over a selected date range.
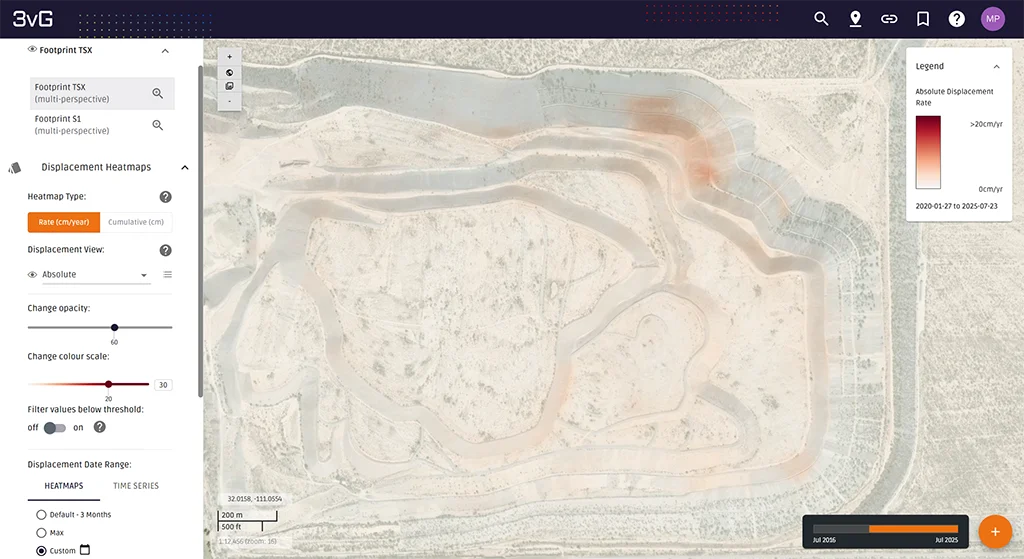
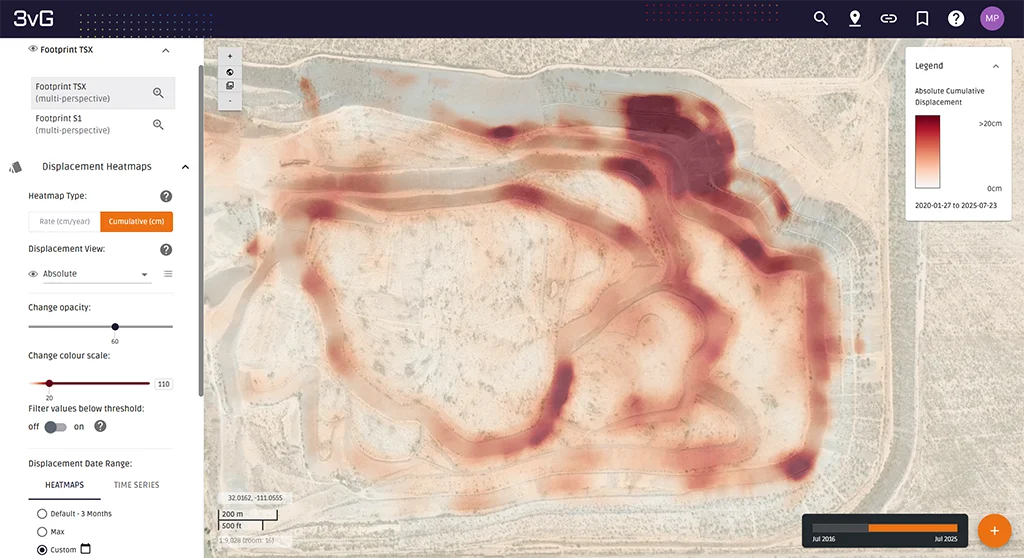
A comparison of heatmap types over a five-and-a-half-year period. While the displacement rate heatmap (top, scaled at 0 to 20 cm/year) might suggest minimal displacement, switching to the cumulative displacement heatmap (bottom, scaled at 0 to 20 cm) clearly reveals hotspots indicating significant total ground movement.
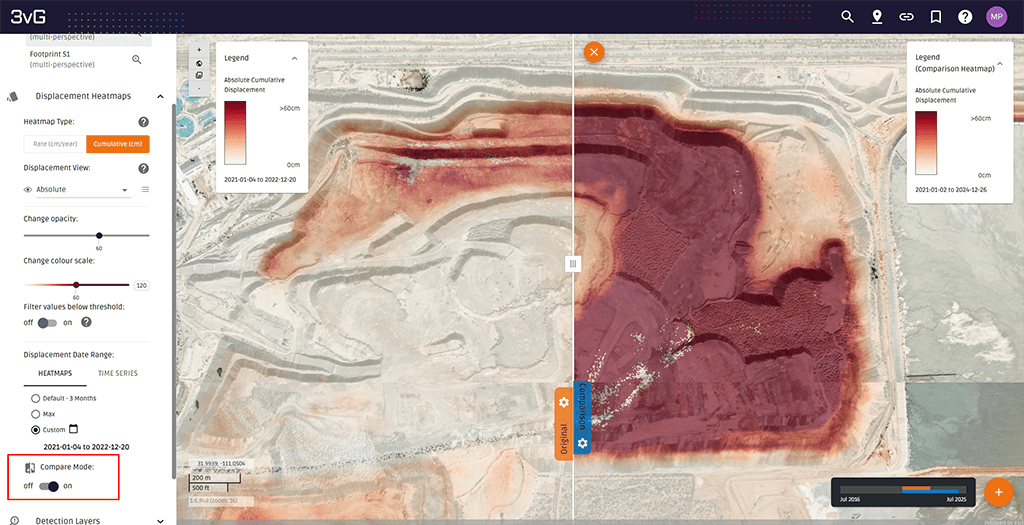
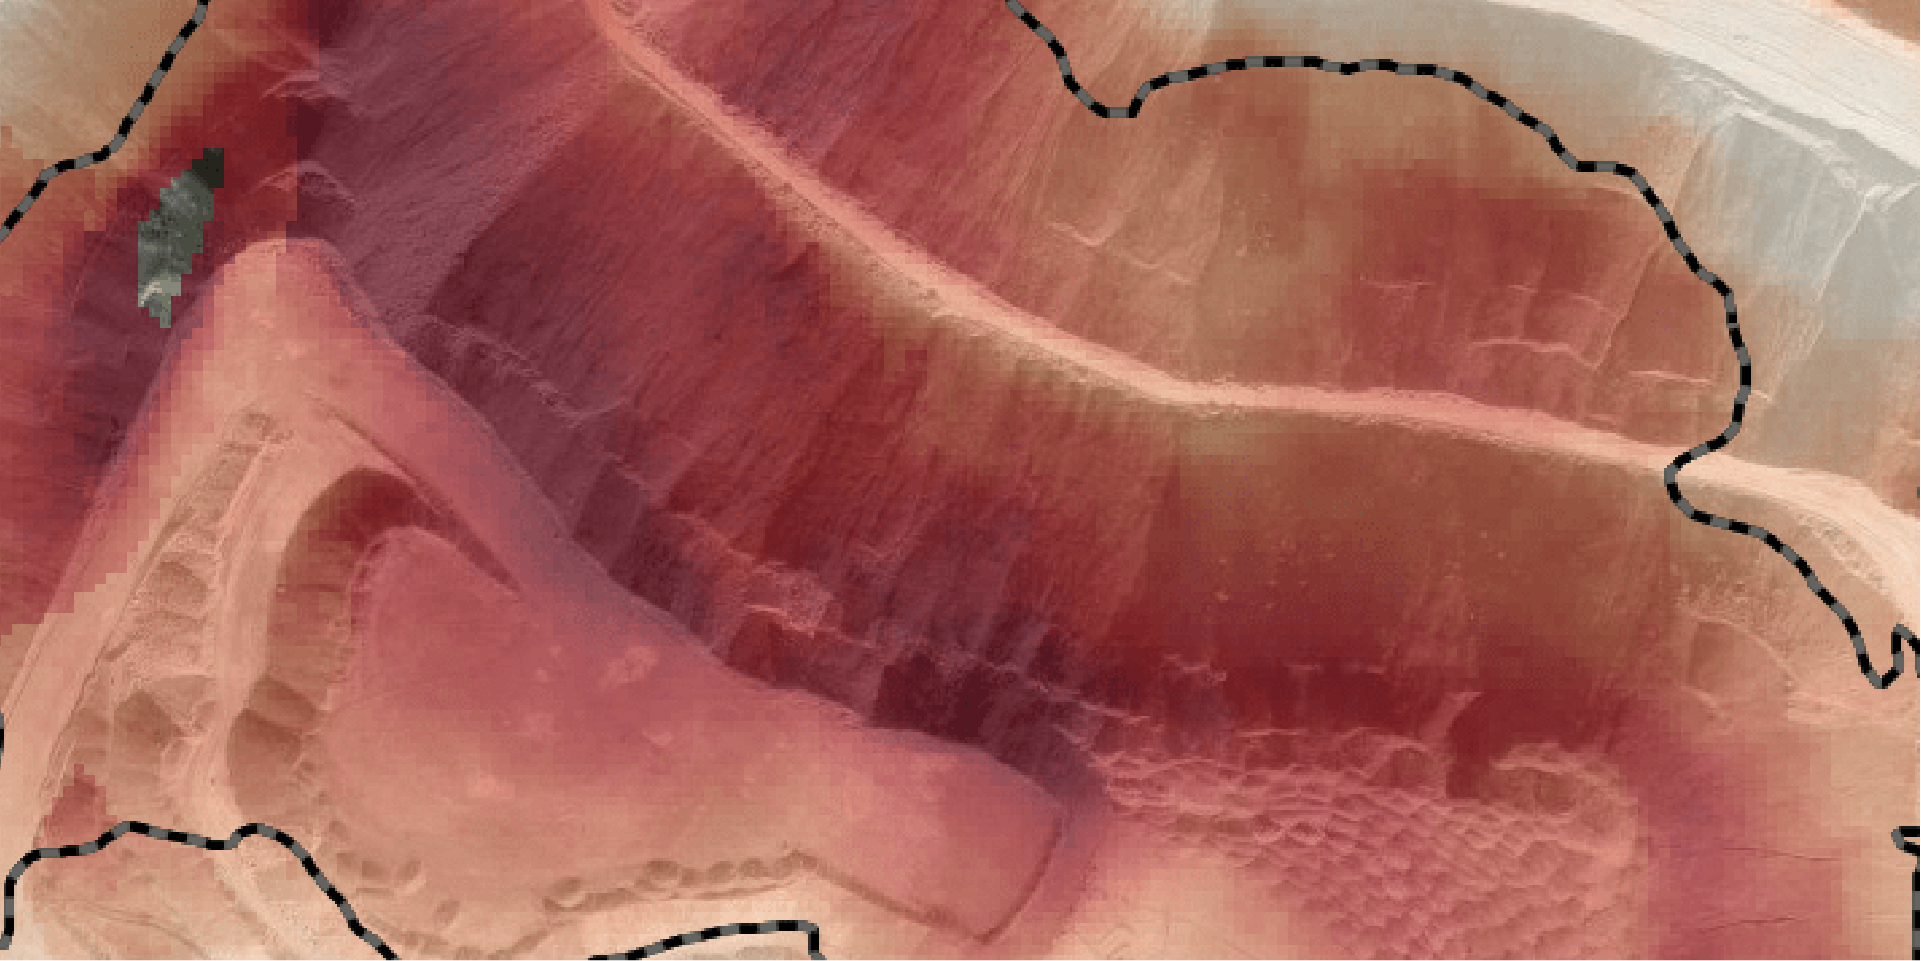
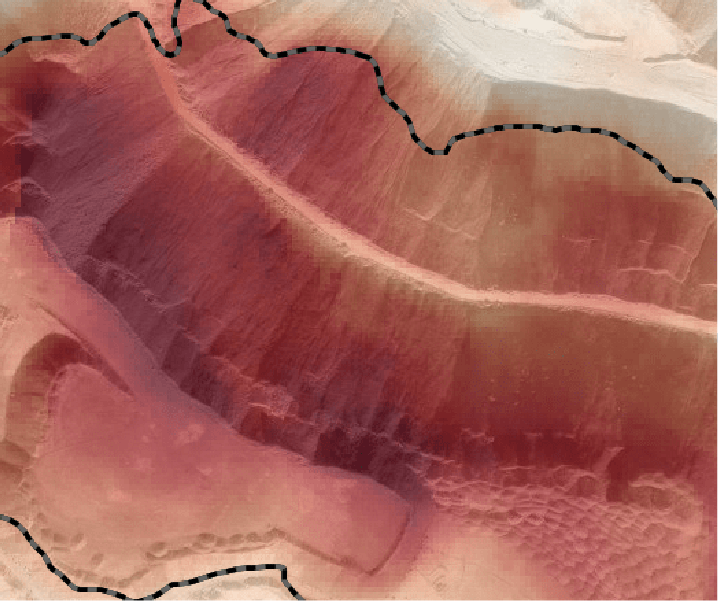
Utilizing Motionary's Compare Mode to visualize cumulative displacement over different time periods. The left part of the screen shows two years of cumulative displacement (scaled at 0 to 60 cm), while the right part displays four years of cumulative displacement (also scaled at 0 to 60 cm).
This comparison clearly highlights how accumulated displacement in the stockpile increases over the longer four-year period. The introduction of cumulative displacement heatmaps in Motionary provides users with a more comprehensive visualization of ground movement over time.
By offering both displacement rate and cumulative displacement heatmaps, Motionary gives users more flexibility to analyze InSAR data. The ability to switch between these heatmap types can reveal critical insights that might otherwise remain obscured, allowing users to gain a deeper understanding of their site.